OpenLayers 3实践与原理探究2-ol3基础入门案例

【注】所有代码挂在我的github

0.实例

在OpenLayers3官网的下载页面下载我们在开发工程中需要的文件(如:v3.17.1-dist.zip),实际工程中包含两个文件ol.js,ol.css
先看一个实例代码如下:

1
2
3
4
5
6
7
8
9
10
11
12
13
14
15
16
17
18
19
20
21
22
23
24
25
26
27
28
29
30
31
32
33
34
35
36
37
38
39
40
41
<!DOCTYPE html>
<html lang="en">

<head>
<meta charset="UTF-8">
<title>1-TileWMS</title>
<link rel="stylesheet" href="css/ol.css">
</head>

<body>
<div id="map">
</div>
<script type="text/javascript" src="js/ol-debug.js"></script>
<script type="text/javascript">
/*初始化地图*/
var map = new ol.Map({
target: 'map', //document.getElementById("map")

layers: [
new ol.layer.Tile({
title: "Global Imagery",
source: new ol.source.TileWMS({
url: 'http://demo.boundlessgeo.com/geoserver/wms',
params: {
'LAYERS': 'ne:NE1_HR_LC_SR_W_DR'
}
})
})
],
view: new ol.View({
projection: 'EPSG:4326', //WGS 84
center: [0, 0],
zoom: 2,
maxResolution: 0.703125
}),

});
</script>
</body>

</html>

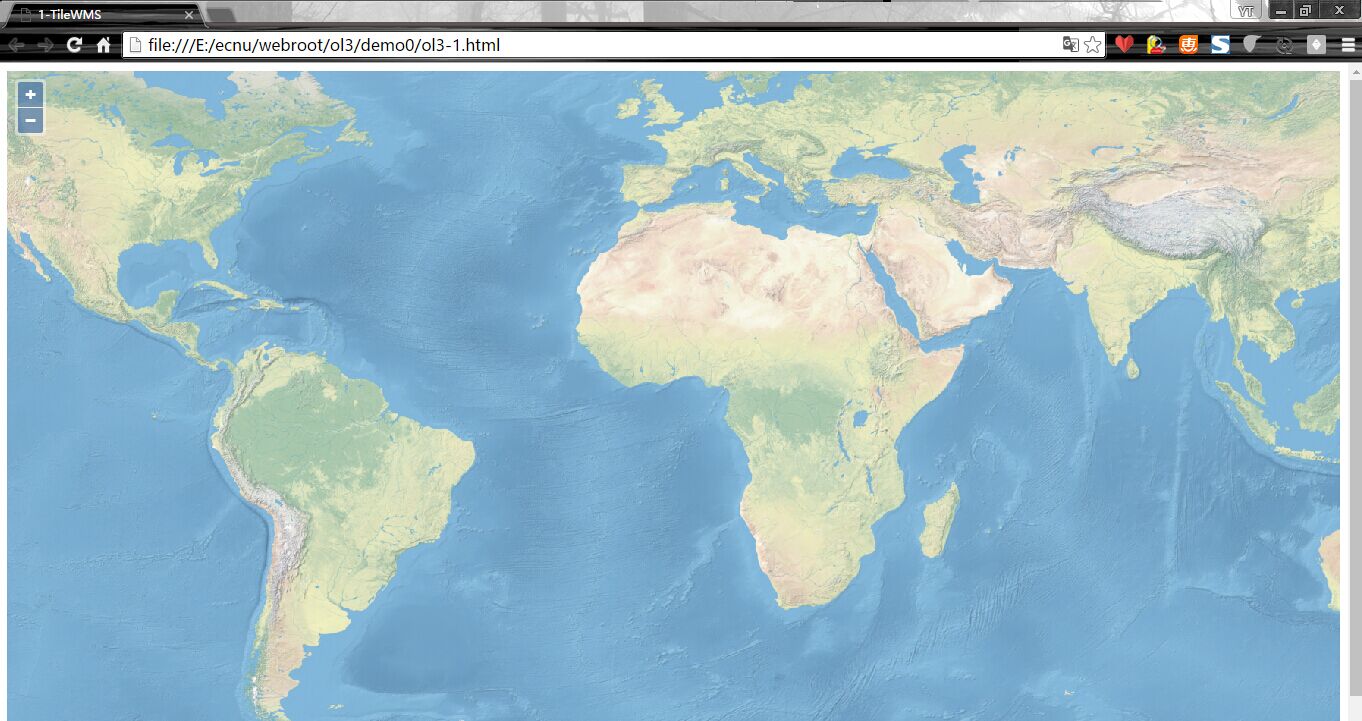
效果图:
ol3讲解实例效果图

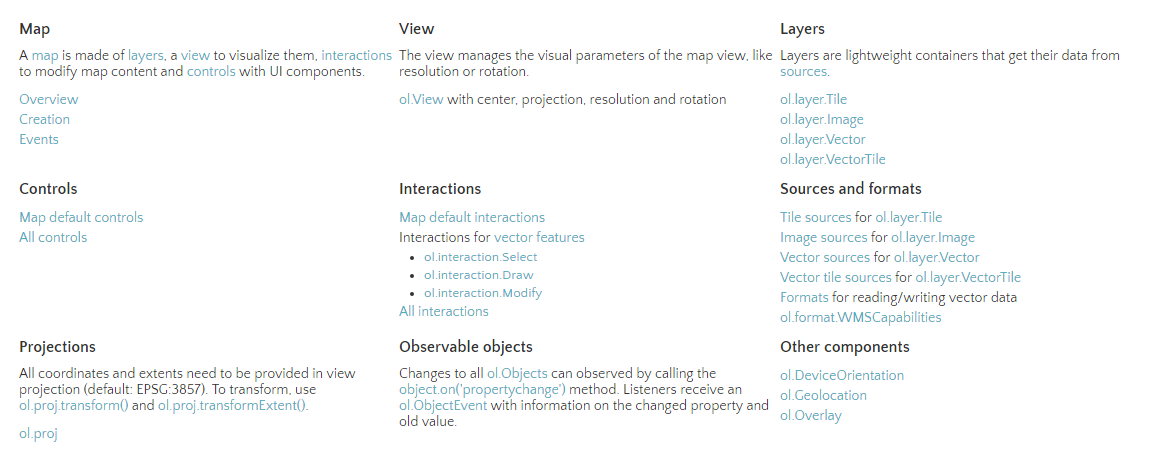
通过api的overview我们可以看到ol3的核心部件
ol3-api-overview

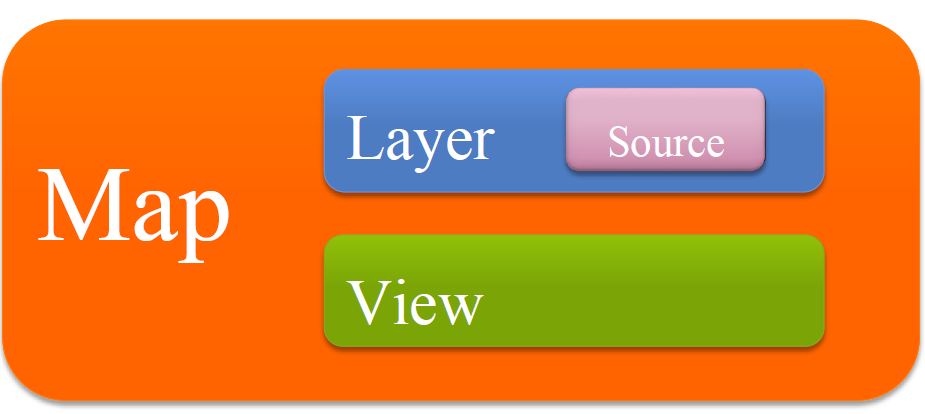
1.基本概念

ol3基本概念的关系

1.1 Map

Map(ol.Map)是OL3的核心部件,它被呈现在target容器上(div)。也可以使用setTarget方法。
位置:ol/ol/map.js

1
var map = new ol.Map({target: 'map'});

1.2 View

ol.View负责地图的中心点,放大,投影之类的设置。
一个ol.View实例包含投影projection,该投影决定中心center 的坐标系以及分辨率的单位,如果没有指定(如下面的代码段),默认的投影是球墨卡托(EPSG:3857),以米为地图单位。

放大zoom 选项是一种方便的方式来指定地图的分辨率,可用的缩放级别由maxZoom (默认值为28)、zoomFactor (默认值为2)、maxResolution (默认由投影在256×256像素瓦片的有效成都来计算) 决定。起始于缩放级别0,以每像素maxResolution 的单位为分辨率,后续的缩放级别是通过zoomFactor区分之前的缩放级别的分辨率来计算的,直到缩放级别达到maxZoom 。

1
2
3
4
5
6
7
8
9
10
var map = new ol.Map({
target: 'map',
view: new ol.View({
projection: 'EPSG:4326', //WGS 84
center: [0, 0],
zoom: 2,
maxResolution: 0.703125
}),

});

1.3 Source

OpenLayers 3使用ol.source.Source子类获取远程数据图层,包含免费的和商业的地图瓦片服务,如OpenStreetMap、Bing、OGC资源(WMS或WMTS)、矢量数据(GeoJSON格式、KML格式…)等。

1
var osmSource = new ol.source.OSM();

1.4 Layer

一个图层是资源中数据的可视化显示,OpenLayers 3包含三种基本图层类型:ol.layer.Tile(瓦片)ol.layer.Image(图片样式的图层)和 ol.layer.Vector(矢量图层)

  • ol.layer.Tile 用于显示瓦片资源,这些瓦片提供了预渲染,并且由特定分别率的缩放级别组织的瓦片图片网格组成。
  • ol.layer.Image用于显示支持渲染服务的图片,这些图片可用于任意范围和分辨率。
  • ol.layer.Vector用于显示在客户端渲染的矢量数据。
1
var osmLayer = new ol.layer.Tile({source: osmSource}); map.addLayer(osmLayer);

1.5 控件与交互

1.5.1 控件

1
2
3
4
5
6
7
8
9
10
var map = new ol.Map({
controls: ol.control.defaults().extend([
new ol.control.FullScreen(), //全屏控件
new ol.control.ScaleLine(), //比例尺
new ol.control.OverviewMap(), //鹰眼控件
new ol.control.Zoom(),
]),
layers: [bglayer, vector], //添加两个图层
target: 'map', //div#id='map'
});

1.5.2 交互

1
2
3
4
5
6
7
8
9
10
11
12
var select = new ol.interaction.Select({
wrapX: false
});

var modify = new ol.interaction.Modify({
features: select.getFeatures()
});
var map = new ol.Map({
layers: [bglayer, vector], //添加两个图层
target: 'map', //div#id='map'
interaction:ol.interaction.defaults().extend([select, modify])
});

或者用方法的方式添加:

1
2
3
4
5
6
7
draw = new ol.interaction.Draw({
source: source,
type: /** @type {ol.geom.GeometryType} */ (shapeName),
geometryFunction: geometryFunction,
maxPoints: maxPoints
});
map.addInteraction(draw); //增加的交互